Estimating Human Ancestry
Inferring the historical origins of unknown persons can provide valuable clues to their identity.
In the 1990’s a skull, about 8,500 years old, was discovered in Kennewick, WA . Judging by where and when this skull dates from, the evidence clearly pointed to the skull belonging to a Native American ancestor. The tribes in the region wished to rebury the remains. However, anthropological analysis of the skull suggested that the individual was Southeast Asian or ancient Japanese, rather than Native American. If the local anthropologist was correct, then “Kennewick Man” was of deep interest to scientists and historians. Joining the debate were Norse pagan activists, leaning on the possible inference that the skull was European in origin. They too wanted to claim the remains as one their own. What should have been a simple scientific assessment became a political football that ran on for years.
Kennewick Man was an ancestor to modern Native Americans. We know this because we now have ancient genomic analysis tools. This individual clearly clusters with the genomes of modern and ancient Native American people. Case closed.
My post about the Lake Stickney John Doe highlights a common challenge in estimating ancestry from human remains. Many of the unidentified person cases in NamUs have little evidence beyond a skull or sparse skeletal remains. Investigators and anthropologists do their best to make an educated guess as to ancestry and possible physical appearance of an unknown person. However, it is not uncommon to see conflicting assessments and sometimes it is not even possible to make a guess at all. The bottom line is that complete assessment of human ancestry requires DNA testing.
How common is this issue of uncertain ancestry? I turned to NamUs and looked at the 13,420 unidentified persons (UP) records currently in the database. For each record, I examined the “Race / Ethnicity” assignment and here is what I found:
-
White / Caucasian - 4,607 (34%) records
-
Multiple or Uncertain - 4,600 (34%) records
-
Black / African American - 1,978 (15%) records
-
Hispanic / Latino - 1,755 (13%) records
-
Asian - 246 (1.8%) records
-
American Indian / Alaska Native - 70 (0.5%) records
A third of the unidentified persons records in NamUs do not have a clear assignment of ancestry. Surely, at least some of the records with clearly assigned ancestry are wrong. So the issue of uncertain ancestry is common for these cases. What is anthropological assessment of ancestry and what are the sources of uncertainty? Take a look at the below set of human skulls. Don’t worry, they are replica skulls made from a cast and not real human bone:
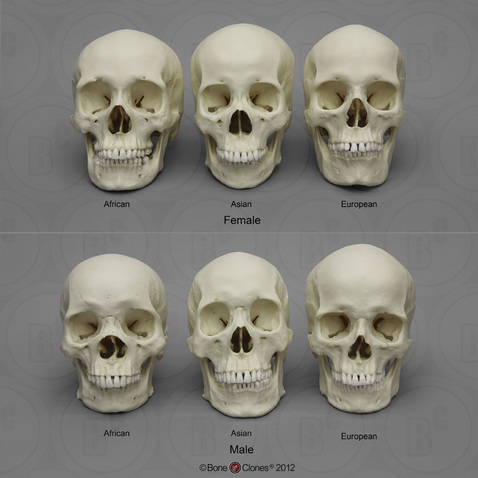
To the untrained eye, the skulls look very similar. With training, anthropologists learn to estimate ancestry on the basis of morphological measurements of the skull and other parts of the skeleton. Although methods have improved over recent years, these estimates are prone to inaccuracy and misclassification. What you look like is not a perfect predictor of your ancestry or historical origins. For example, there are people, like the Icelandic singer Bjork, who might be mistaken for Asian, but are not Asian. This happens because human beings overlap a great deal in their physical appearance, no matter their race.
These methods are not junk science, but they are not very precise, because they do not use the full range of information. The shape of someone’s nose, the height of their cranial vault, or the cleft in their chin, is real information. But its a small subset of the data on which to make such an important judgement as one’s historical origins. Genetic admixture further complicates analyses that were trained on datasets that focus on the extremes of human morphological variation.
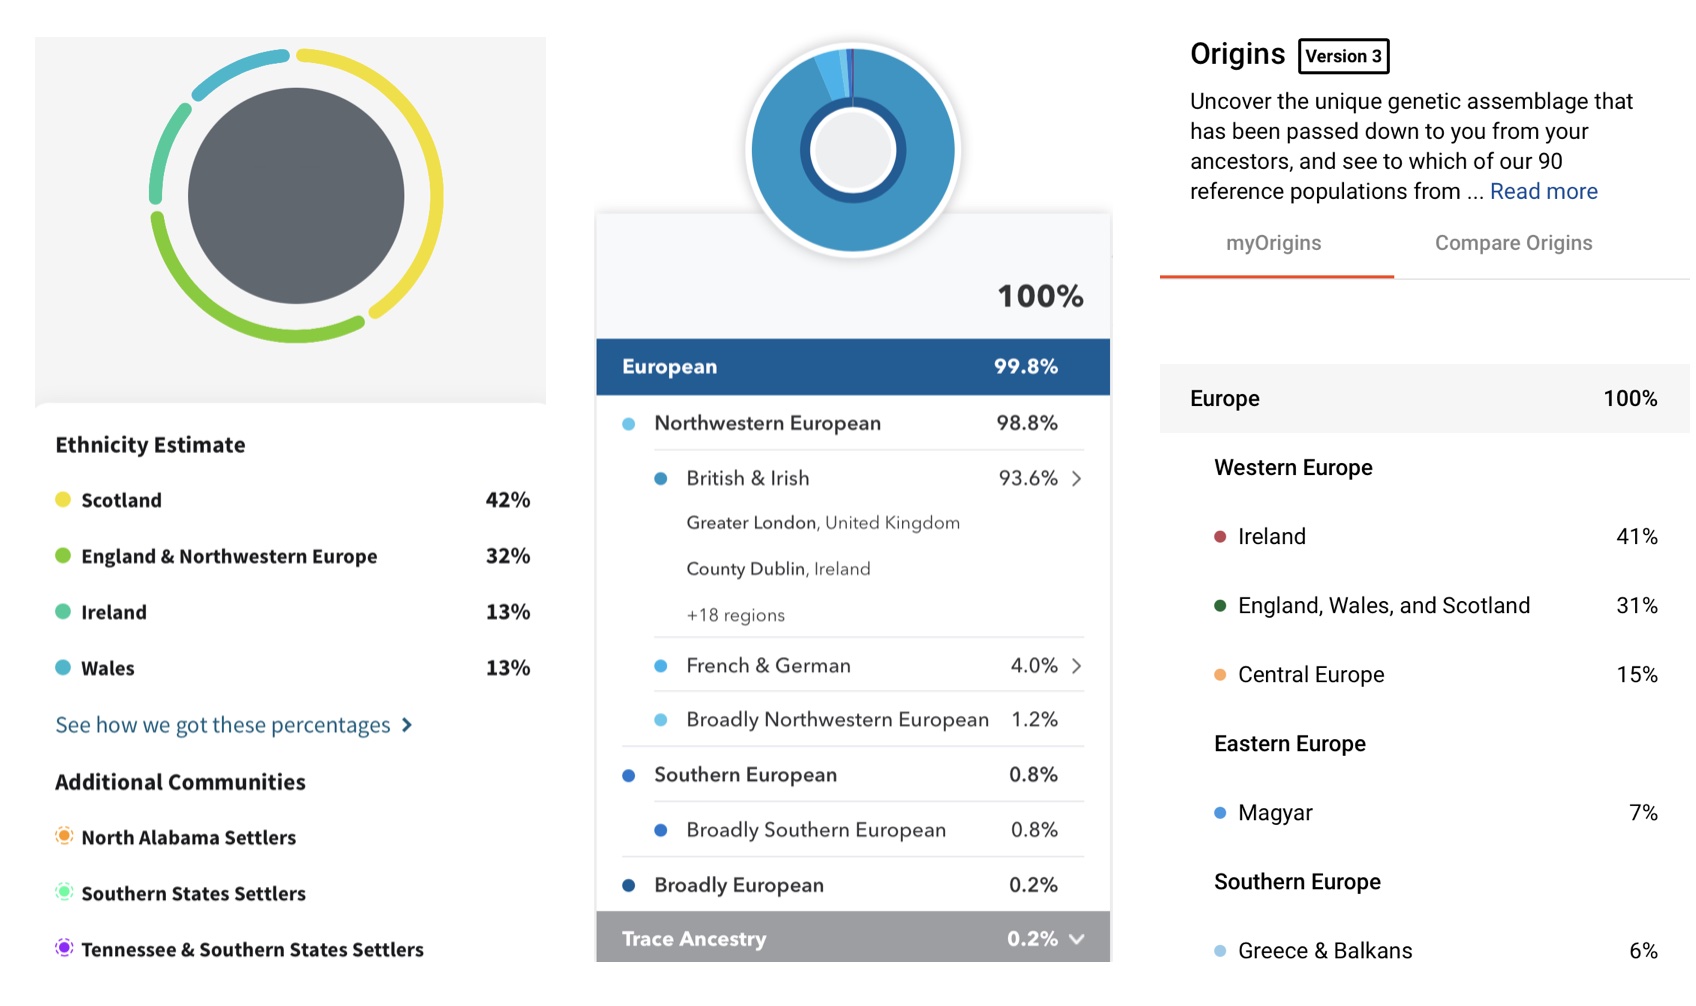
Biogeographical ancestry analysis (BGA), as some call it, leverages genetic testing to infer a person’s historical origins. Our genome contains billions of genetic data points. The analysis of genomic data can provide more accurate and higher-resolution ancestry information because there are so many data points from which to compare people. Consumer genetic testing companies like 23andMe, AncestryDNA, and FamilyTreeDNA have built recreational tools to interpret some of this information:
In a typical genetic analysis, tens of thousands to hundreds of thousands of markers are leveraged. Population geneticists also have databases of individuals that have self-reported as having multi-generational family histories from a particular area or population. These people who self-report family histories comprise what is often called reference panels. These databases of reference panels can contain hundreds of thousands of people. Biogeographical analysis therefore involves comparing as many as hundreds of thousands of genetic markers in a database to hundreds of thousands of people. That’s a lot of data.
Though there are many fancy models you can use to figure out who is related to whom, the simplest methods of counting up differences in a genetic sequence perform reasonably well. People from a given ancestral group tend to have fewer differences from each other because they share common ancestors and have not been separated from each other as long and people that come from different groups. The analysis is granular and so when a genetic admixture is involved, it is possible to partition someone’s genome in segments of DNA that best match to different groups. This is how consumer genetic testing companies report percentages. The variation in percentages and the number of populations to which someone can be assigned is largely a function of what sorts of reference panels are used.
Obviously, the same principles apply to skeletal features. Just look at differences and similarities, and make a list from most to least related. But if you are counting tens to hundreds of skeletal features per person, the random component is large and susceptibility to “noise” in the system is greater. In contrast, with thousands and thousands of pieces of DNA information the noise is reduced substantially.
Imagine that you flipped a coin 20 times. You expect 10 tails and 10 heads. But it will vary quite a bit. This is similar to looking at a skull and measuring 20 characteristics to make an inference. Now imagine flipping a coin hundreds of thousands of times. The fraction of heads to tails will be much closer to 50:50.
Precision is the promise of genomics. With more affordable DNA testing, large datasets, and modern computing, we can supplement 20th century forensic methods with new tools that will herald a future in which we not only produce more accurate measures of ancestry but also more personalized information about a person’s origins, even to specific areas or population groups. When working cold cases we should expect, and in fact demand, this complete genomic analysis because every detail matters and any detail could be a clue. The Othram team, in fact, took this approach in helping locate the family of an unidentified man, known previously as “Mostly Harmless” . Biogeographical analysis methods are also reproducible. They rely on formal analysis and computational frameworks, not intuition and experience. The methods are precise, and, they are transparent. As more data becomes available, they will also improve.
Let’s hope that future iterations of NamUs will include this valuable data. There are lots of unidentified persons cases to resolve and likely a few hundred cold cases overall, in the United States. We need all the clues we can get to help solve these cases.
« Back to the blog